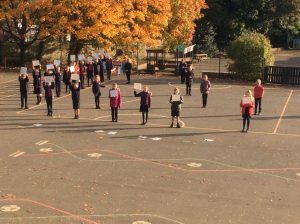
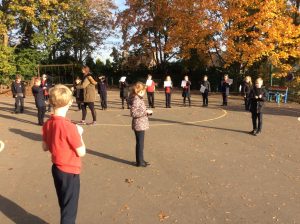
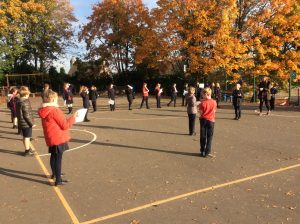
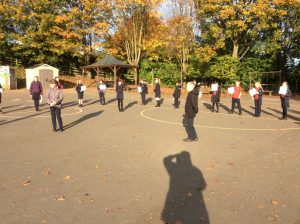
As part of our statistics topic in Maths, we have been looking at line graphs. We’ve worked on how to read and interpret data and then moved onto being able to draw our own. To help with this, we went outside on the playground and became the data ourselves. Some people were the Y axis, some the X axis and others were the actual co-ordinates. We then used string to connect our dots to make our line and answered questions about our line graph.


