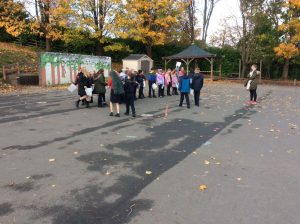
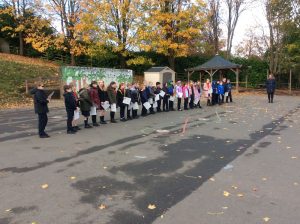
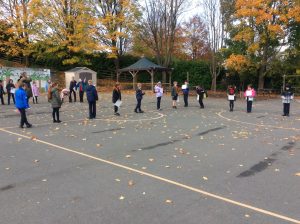
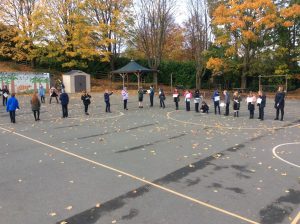
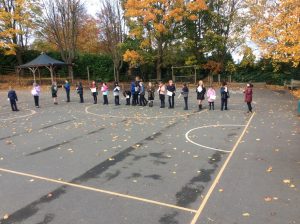
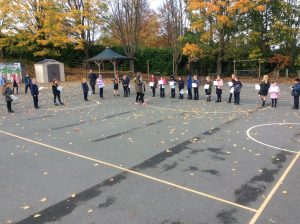
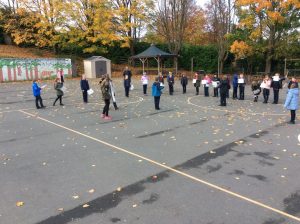
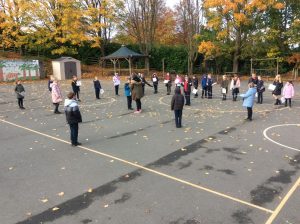
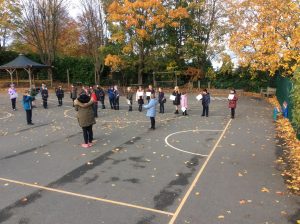
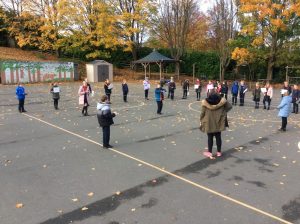
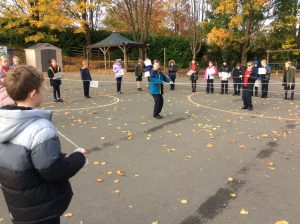
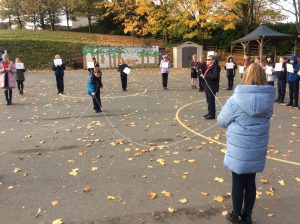
Today, as part of our Statistics topic in Maths, we looked at the different elements of line graphs and what we would need to create our own. We decided that we were going to create our very own Tranmere Park Garden Centre and monitor the number of benches sold over a week. Apparently, benches are a very popular garden staple in the gardens of Tranmere Park, who knew?
We looked at both the x-axis and the y-axis and then created some data so we were able to plot our points. We then used string to connect our plotted points and create our Human Line Graph.
We all agreed that we now knew the things we need to include and think about when drawing line graphs and can’t wait to create our own in our books later on this week!
Take a look!
